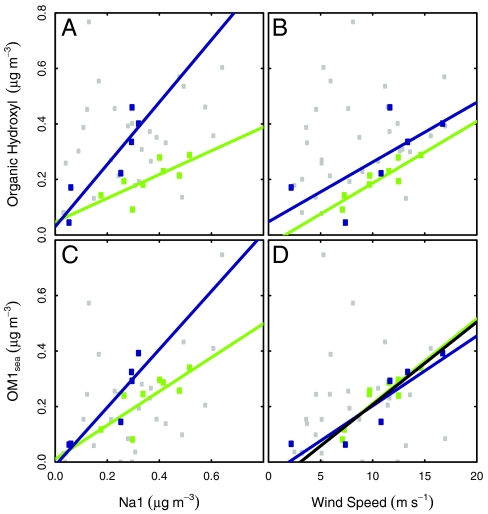
Fig. 2.
Dependence of concentration of FTIR organic hydroxyl group concentration on (A) Na1 concentration (r = 0.74 for North Atlantic; r = 0.89 for Arctic; r = 0.30 for all), (B) wind speed (r = 0.89 for North Atlantic; r = 0.70 for Arctic; r = 0.26 for all), and dependence of concentration of PMF marine factor OM1sea on (C) Na1 concentration (r = 0.78 for North Atlantic; r = 0.91 for Arctic; r = 0.51 for all), (D) wind speed (r = 0.91 for North Atlantic; r = 0.90 for Arctic; r = 0.30 for all). Symbols and fit lines (with coefficients given in Table S3) are colored by sector as in Fig. 1; black line in (D) is the fit for both North Atlantic and Arctic sectors together, as given in Eq. [1].

