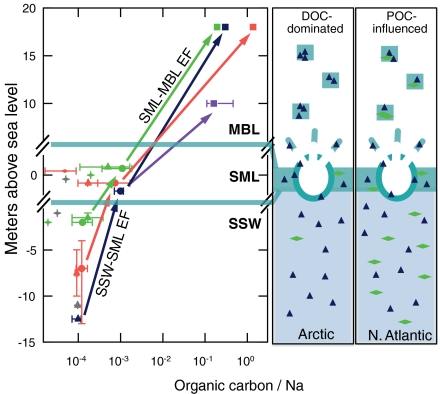
Fig. 6.
Comparison of atmospheric and seawater ratios of organic carbon for the surface microlayer (SML) and OC1sea concentration in the marine boundary layer to Na1 concentration for Barrow Winter (purple), VOCALS-REx Southeast Pacific (salmon), ICEALOT North Atlantic (chartreuse), and ICEALOT Arctic (dark blue). SSW indicates subsurface water and MBL indicates marine boundary layer aerosol. The arrows show estimated MBL-SSW enrichment factors (EF) for each regional average aerosol OC1sea/Na1 based on measurements made previously in the same region for TOC/Na as listed in Table S4 [except for the Arctic where TOC is estimated based on Thurman et al. (29)], in which we note that seasonal differences are neglected: MBL-SSW EF are 174 (ICEALOT North Atlantic), 304 (ICEALOT Arctic), 160 (2008 Barrow summer), and 1843 (VOCALS SE Pacific). The cartoons on the right illustrate the differing amounts of POC and DOC that contribute to particle formation from bubble bursting in the Arctic and North Atlantic regions.

