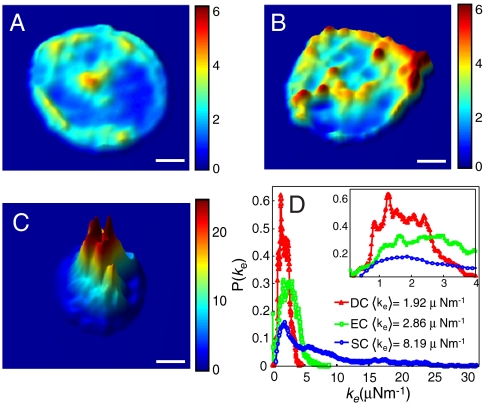
Fig. 2.
The effective spring constant (ke). (A)–(C) Typical effective spring constant map for DC (A), EC (B), and SC (C). Color bars are in μNm-1; scale bar, 1.5 μm. (D) Corresponding histograms of the effective spring constant. The legend shows the respective mean values 〈ke〉. The inset details the 〈ke〉 behavior in the vicinity of the origin.

