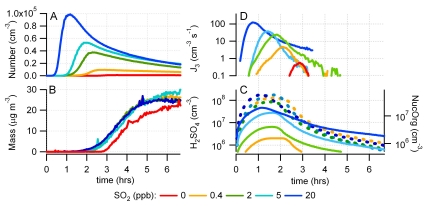
Fig. 1.
(A) Aerosol particle number (Dp ≳ 3 nm) and (B) mass concentration (not corrected for WLs) of five individual experiments at 250 ppb TMB and varying SO2 mixing ratios of 0 to 20 ppb. (C) Calculated concentrations of H2SO4 (solid lines) and NucOrg (dashed lines). Variation of NucOrg is due to slightly different reactivity in the initial phase of the experiment and different condensation sink. (D) Appearance rate of 3-nm particles.

