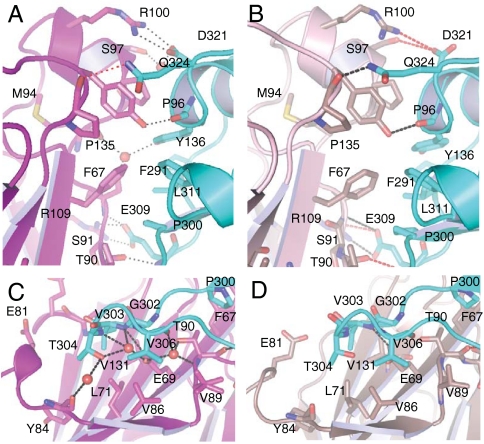
Fig. 4.
Close-up views of the XRCC1-NTD/Pol β PT interface. (A and C) oxidized complex, (B and D) reduced complex; hydrogen bonds less than 3.4 Å are indicated with black dashed lines; hydrogen bonds greater than 3.4 Å are indicated with red dashed lines, and water molecules are shown as red spheres. XRCC1-NTD shown in magenta tones with Pol β CD shown as a cyan ribbon.

