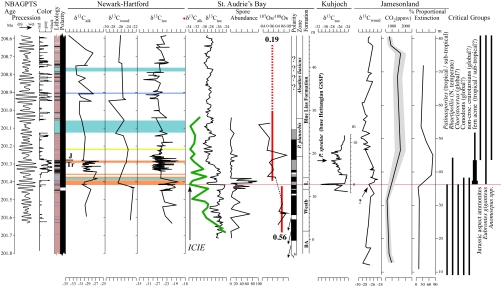
Fig. 4.
Detailed comparison and correlation between the Newark and Hartford compound-specific carbon isotopes of the weighted mean odd C25–C31 n-alkanes ( ) from lacustrine rocks interbedded with the CAMP flood basalt flows (from Fig. 2) with environmentally and biological relevant data from other sections. These are new compound-specific carbon isotopes of the weighted mean odd C25–C31 n-alkanes (
 ) from St. Audrie’s Bay and total organic carbon (
 ) data from refs. 4 and 7, Os isotopic data from ref. 33, and paleomagnetic polarity stratigraphy from ref. 20, all from St. Audrie’s Bay; carbon isotope data from wood (
 ) (9), leaf stomatal density proxy data for CO2 (9) and floral species extinction rate [Proportional Extinction (%)] from Jamesonland, Greenland (Astartekløft); and the ranges of critical taxa (pollen, Patinasporites and Rhaetipollis, cited in refs. 16 and 20), invertebrates (Choristoceras) (4, 35), conodonts (20), “Jurassic aspect” ammonites including P. spelae (35) and P. planorbis (20), and tetrapod footprint (16) (noncrocodylomorph crurotarsans) (e.g., Brachychirotherium and Apatopus and the large theropod dinosaur track Eubrontes giganteus). CAMP basalt flows in the Newark and Hartford basins are indicated by the light blue-green bars (flows) and a basaltic ash by a dark blue bar (Pompton Tuff, SI Text), while other CAMP basalt flows are shown in orange for the Central High Atlas from Morocco (24, 25), and yellow for the Culpeper basin (Virginia) (23). Jamesonland data correlated to St. Audrie’s Bay and Newark and Hartford sections by the initiation of the plant extinctions (terrestrial ETE) and wood isotopic records. Abbreviations are as in Fig. 2 with the addition of BA, Blue Anchor Formation; L, Lilstock Formation; and Westb, Westbury Formation.

