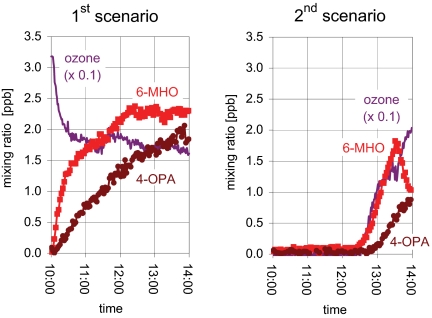
Fig. 3.
Mixing ratios of O3 (values plotted are 1/10 measured values), 6-MHO, and 4-OPA in the simulated office. (Left) First scenario: two subjects entered at 10:00 and remained in the room until the end of the experiment. (Right) Second scenario: two subjects entered the simulated room at 09:00; at 12:00 the ozone generators were turned on; at 13:30 the subjects left the room, and the ozone generators remained on.

