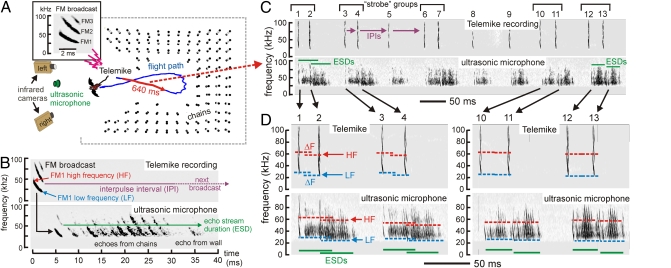
Fig. 1.
(A) Perspective plan view of chain array from above, with video-reconstructed bat flight path in blue. The red section of the blue track traces the 640-ms segment related to sounds in C and D. (Inset } Spectrogram of a typical FM big brown bat broadcast during flight (harmonics are FM1, FM2, and FM3). (B) Spectrogram of Telemike channel (Upper) shows single FM broadcast. Corresponding ultrasonic microphone channel (Lower) shows stream of echoes from chains and wall. Labels show parameters extracted from sounds (IPI, high frequency, low frequency, ESD). (C) Spectrograms of broadcasts and echoes recorded during 640-ms red-marked segment of flight at Telemike (Upper) and ultrasonic microphone (Lower). IPIs show strobe groups. The ultrasonic microphone registered smears of echoes from the chains following each broadcast. (D) Expanded view of broadcasts 1 and 2, 3 and 4, 10 and 11, and 12 and 13 to show IPIs, ESDs, and ΔFs for strobe groups. HF, high frequency; LF, low frequency.

