Fig. 5.
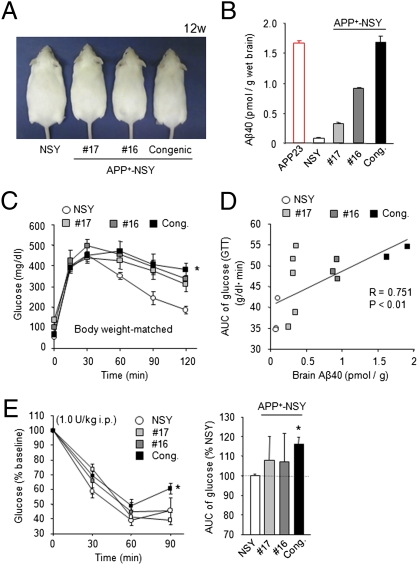
Metabolic features of APP+-NSY mice. (A) Appearance of APP+-NSY mice (mice 16 and 17 and congenic mice) at 12 weeks. (B) Brain Aβ levels of each APP+-NSY mice lines (12-week-old age). (C) GTT in body weight–matched mice groups. Body weight–matched NSY and APP+-NSY mice were used for the experiment (n = 3–5). *P < 0.05 for APP+-NSY congenic mice compared with NSY mice. (D) Significant positive correlation between brain Aβ levels and glucose intolerance (AUC during GTT) in body weight–matched mice groups. P < 0.01, Spearman rank test. (E) Blood glucose levels during ITT (1.0 U/kg, 12 weeks, n = 4–7). *P < 0.05 for APP+-NSY congenic mice compared with NSY mice. Cong., APP+-NSY congenic mice.

