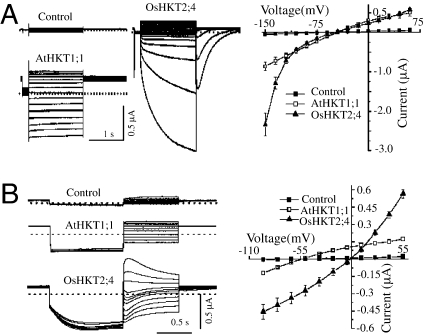
Fig. 1.
Currents generated by AtHKT1;1 or OsHKT2;4 expressed in the Xenopus oocytes. (A) Time dependency and activation kinetics in the currents generated by OsHKT2;4. (Left) Typical whole-cell currents recorded by hyperpolarized pulses from the oocytes injected with water (“Control”) or oocytes expressing AtHKT1;1 (AtHKT1;1) or OsHKT2;4 (OsHKT2;4) perfused with the bath solution containing (in mM) 0.3 K–gluconate, 10 Na–gluconate, 6 MgCl2, 1.8 CaCl2, 185 mannitol, and 10 Mes–Tris. Dotted lines represent the zero current level. The current–voltage relationships were deduced from 15 cells under each condition and presented on the right. (B) (Left) Traces show the typical tail currents generated by the control oocytes or oocytes expressing AtHKT1;1 or OsHKT2;4 recorded with the deactivation protocol. (Right) The current–voltage relationships were deduced from 12 cells/condition.

