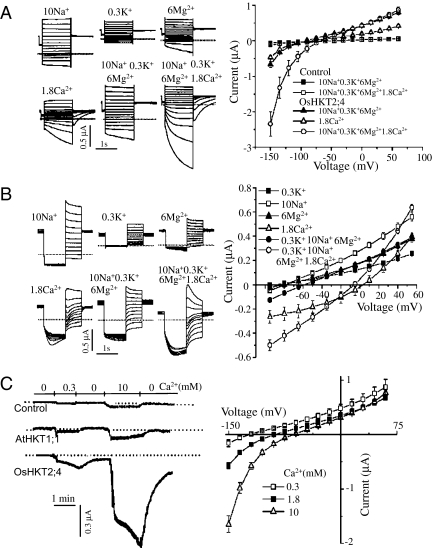
Fig. 2.
Ca2+ determines the kinetics of OsHKT2;4 currents. (A) Ca2+ induced the time dependency and large magnitude in the current recorded by hyperpolarized pulses. The typical current traces were generated by the oocytes expressing OsHKT2;4 perfused with various ions (Left). The mean current data were deduced from the recordings of the control oocytes and the oocytes expressing OsHKT2;4 perfused by the buffer solution containing (in mM) 10 Na+ + 0.3 K+ + 6 Mg2+, 10 Na+ + 0.3 K+ + 6 Mg2+ + 1.8 Ca2+, or 1.8 Ca2+ (Right). (B) Unique tail currents induced by Ca2+. (Left) Traces show the typical tail currents generated by oocytes expressing OsHKT2;4 perfused with various ions. (Right) The mean tail currents were summarized from recordings of the oocytes expressing OsHKT2;4 perfused with the solution containing (in mM) 10 Na+, 0.3 K+, 6 Mg2+, and 1.8 Ca2+, 10 Na+ + 0.3 K+ + 6 Mg2+, or 10 Na+ + 0.3 K+ + 6 Mg2+ + 1.8 Ca2+. (C) The OsHKT2;4 current was sensitive to extracellular Ca2+ concentration. (Left) The typical current traces were recorded at −120 mV from the control oocyte and the oocyte expressing AtHKT1;1 or OsHKT2;4 perfused with a solution containing (in mM) 185 mannitol and 10 Mes–Tris (pH 7.4) with 0, 0.3, or 10 Ca2+. (Right) The current–voltage relationship was deduced from recordings of the oocytes expressing OsHKT2;4. Summarized current data are from 10 cells/condition.

