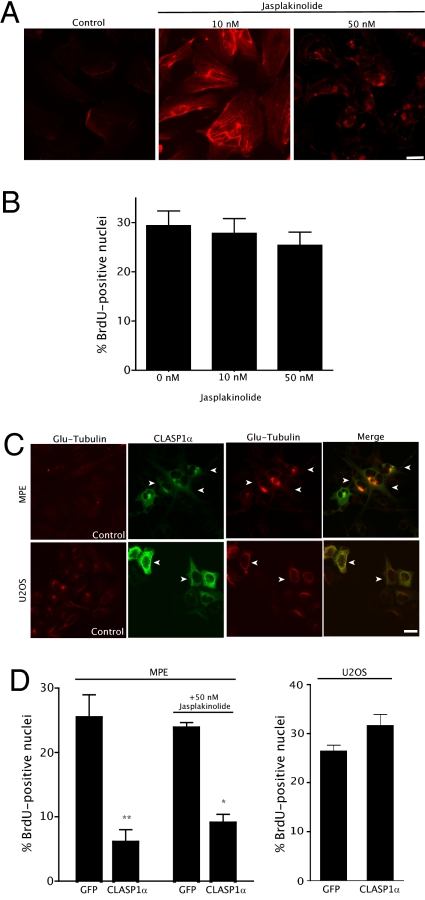
Fig. 3.
MTs rather than actin network changes are responsible for endothelial cell growth inhibition. (A) Jasplakinolide (10 or 50 nM, 16 h) induced actin polymerization. (B) Jasplakinolide did not affect endothelial cell growth. HUVECs were treated with either 10 or 50 nM of jasplakinolide for 16 h and then stained with either phalloidin or anti-BrdU antibody. S-phase cells were counted as in Fig. 1B. Error bars indicate SEM, representing an average of three independent experiments. (C) CLASP1α induces stable MTs in MPE cells. MPE cells were transfected with GFP-CLASP1α. After 24 h posttransfection, stable MTs were visualized with anti-Glu-tubulin antibody. Transfected cells were visualized with an anti-GFP antibody because GFP was quenched by methanol fixation. Arrows indicate transfected cells. (D) CLASP1α inhibited MPE but not U2OS cell growth. Cells were transfected with GFP-CLASP1α for 24 h, with or without 50 nM jasplakinolide for another 24 h, and cells were then fixed and visualized with anti-BrdU antibody. The percentage of S-phase cells among GFP-positive cells was counted as in Fig.1B. Error bars indicate SEM; averages of three independent experiments are displayed. Statistical analyses by one-way ANOVA were performed to yield respective P values (*P < 0.05; **P < 0.001). (Scale bar = 50 μm.)

