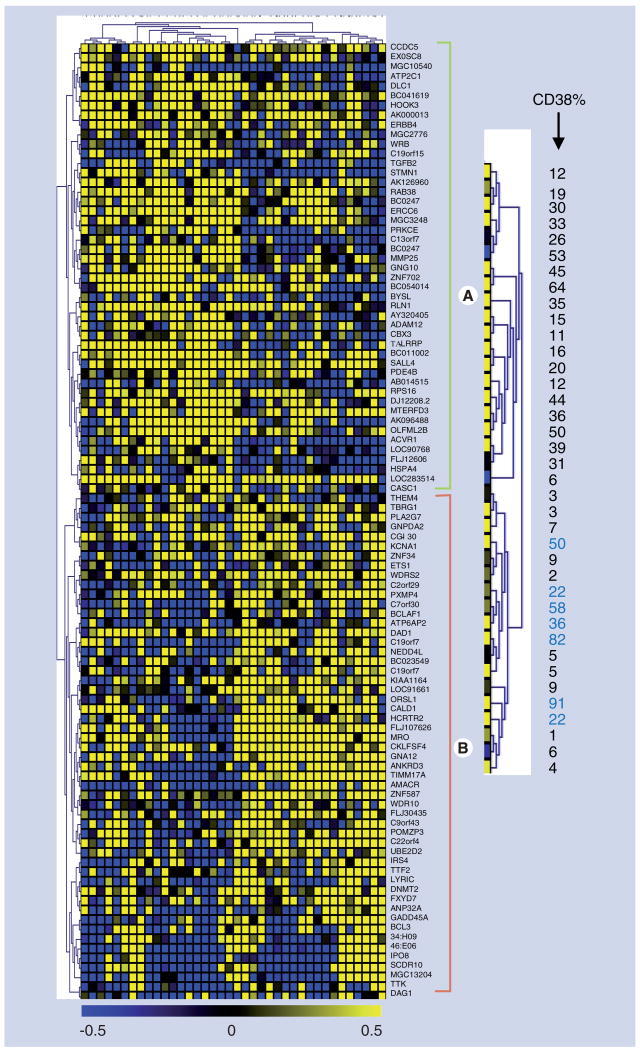
Figure 1. Hierarchical clustering analysis of DNA methylation.
This cluster is based on a 10% threshold where there are 12 samples with less than 10% of the cells expressing CD38 and 26 samples with more than 10% CD38 expression. This illustrates a measure of relatedness of DNA methylation across all loci for each sample. Each column represents a patient sample and each row represents a clone/locus on microarray chip. The florescence ratios of cy3/cy5 are measures of DNA methylation and are depicted as a color intensity (-0.5 to +0.5) in log base 2; yellow indicates loci that have a higher level of DNA methylation in chronic lymphocytic leukemia compared with normal controls, blue indicates a lower level of methylation and black indicates no change. Graded colors across the spectrum represent various levels of methylation. The dendrogram from the top of the cluster (rotated 90° and enlarged on the right) represents the CD38 expression level of each sample. Not every patient sample clustered with the expected group. The numbers shown in blue color are seven patients with CD38high that are clustered in the group of 10% or less, and one sample with 6% CD38 clustered with the CD38high group.

