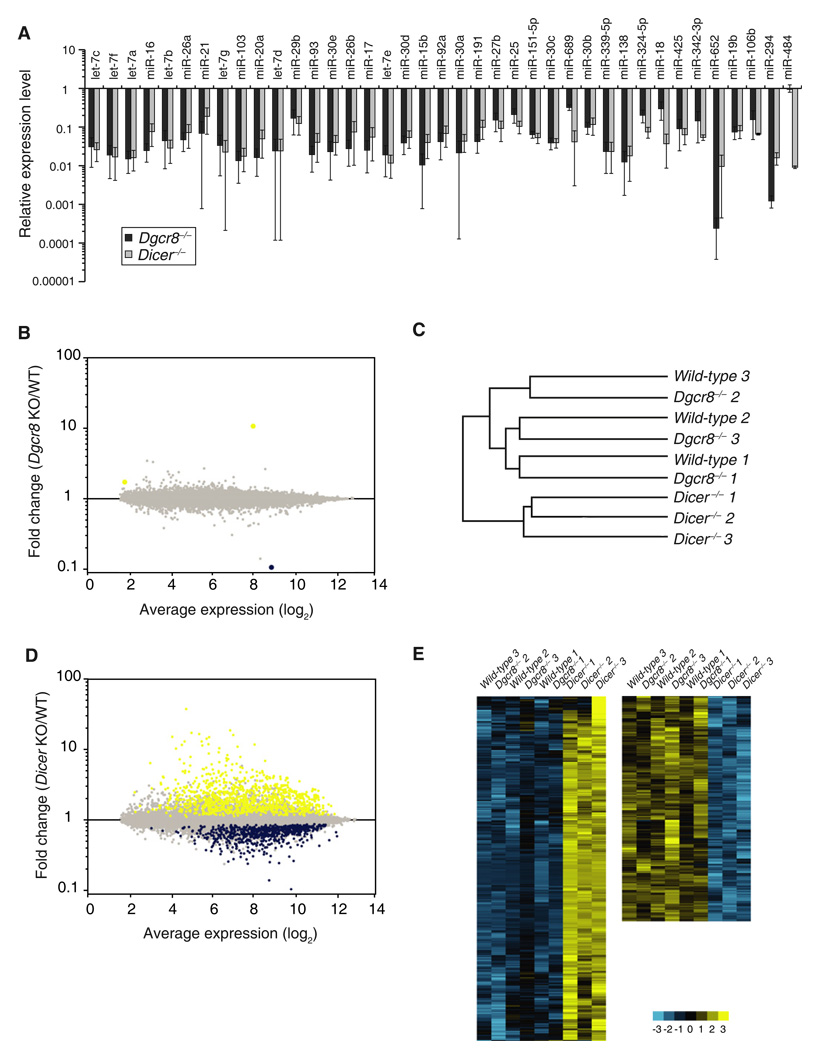
Figure 4. Molecular Effects of Dgcr8 or Dicer Loss in Oocytes.
(A) The expression levels of 40 microRNAs (miRNAs) highly expressed in oocytes were chosen for qRT-PCR TaqMan analysis. Values for wild-type level were set to 1. Error bar denotes SEM of three experiments.
(B) mRNA profiles of Dgcr8−/− versus wild-type oocytes. Yellow represents upregulated transcripts and blue represents downregulated transcripts with false discovery rate (FDR) < 0.05. Each data point represents a transcript.
(C) Dendrogram of mRNA profiles of wild-type, Dgcr8−/−, and Dicer−/− oocytes. Cluster analysis could not distinguish the wild-type from Dgcr8 knockout transcriptomes.
(D) mRNA profiles of Dicer−/− versus wild-type oocytes. Presented as in (B).
(E) Heat maps of upregulated genes (left, yellow) or downregulated genes (right, blue) in Dicer−/− oocytes compared to wild-type and Dgcr8−/− oocytes.

