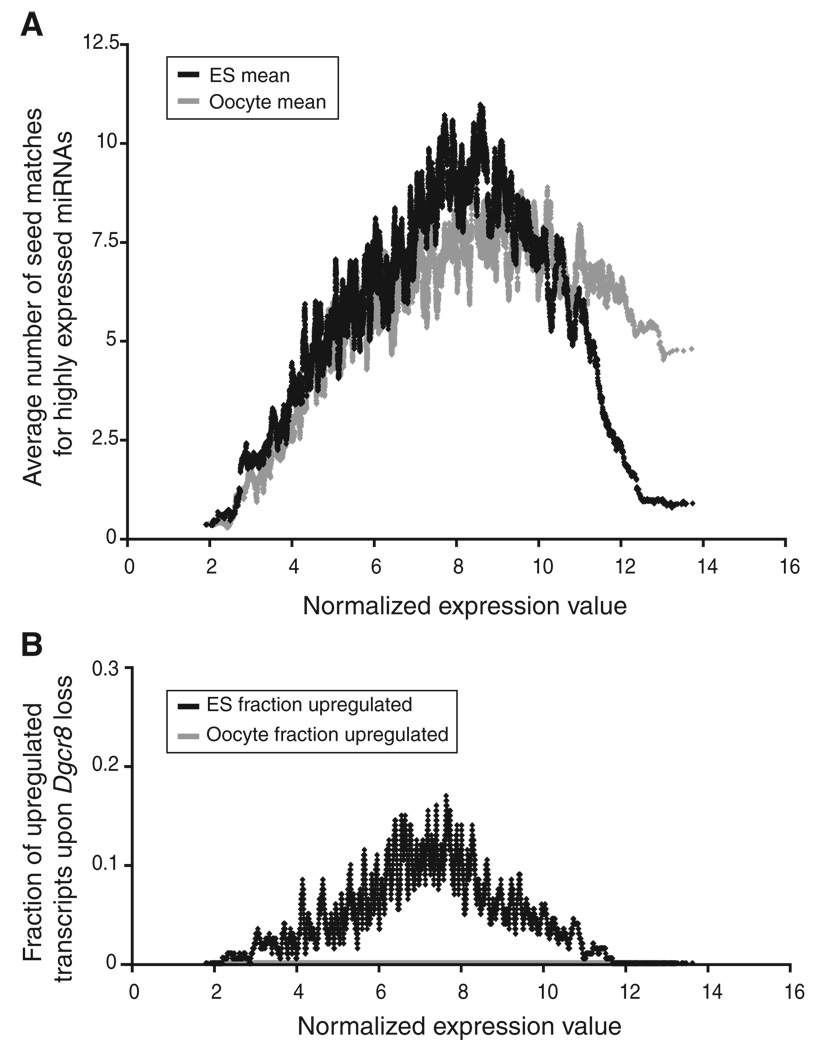
Figure 5. Highly Expressed Oocyte Transcripts Are Not Depleted for Micro-RNA Seed Matches in Their 3′UTRs.
(A) Transcripts are ranked by log2 absolute expression in embryonic stem (ES) cells and oocytes, increasing from left to right (y axis). For each transcript, a local average number of seed matches for the top 44 miRNAs expressed in ES cells (dark gray) and oocytes (light gray) is plotted.
(B) The local fraction of transcripts upregulated with FDR < 0.05 upon Dgcr8 loss in ES cells (dark gray) and oocytes (light gray) is plotted. Note that oocyte transcript levels do not change with Dgcr8 loss and, therefore, data points overlap with the x axis.

