
Fig. 3. .
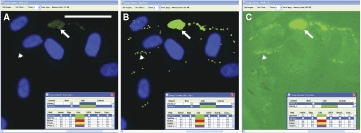
Sensitivity of the Lipid Droplet algorithm. Human preadipocytes were exposed to 0.33 nM rosiglitazone for 9 days, then labeled for nuclei and lipid droplets and imaged using a 40× objective. (A) A field of view is shown in which the brightness of the image is shown at default levels (contrast = 1 in CyteSeer®’s Image Viewer). (B) The same field of view is shown visualized for nuclei and the lipid droplet mask. (C) The same field of view is shown visualized for lipid droplets at contrast = 6 (pixel intensities multiplied by 6-fold and clipped at 255 for the 8-bit image). The arrow denotes a cluster of relatively bright lipid droplets, whereas the arrowhead denotes an example of lipid droplets, identified by CyteSeer®, which are only visible in C. The scale bar is 50 µm.