
Fig. 4. .
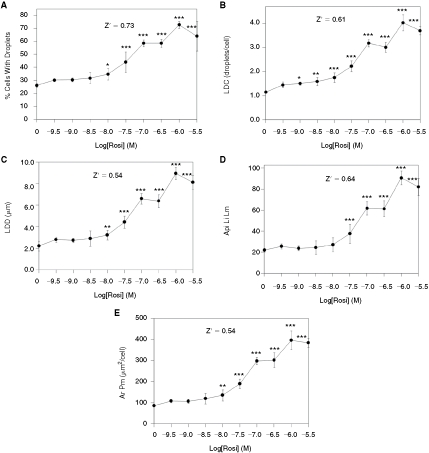
Quantification of lipid droplets and perilipin in primary human preadipocytes exposed to rosi. Cells were exposed to rosi for 9 days, then fixed, stained for lipid droplets, labeled for perilipin, and imaged with a 10× objective (8 images/well were obtained, corresponding to ∼2,000 cells/well). (A) The effect of rosi on the percentage of cells that expressed lipid droplets. (B) The average number of lipid droplets per cell (lipid droplet count). (C) The average lipid droplet diameter. (D) The average pixel intensity of the lipid image for the lipid droplet mask. (E) The average area of the protein mask (which corresponds to the perilipin mask in this experiment). Each bar is the mean ± SD for n = 6 wells. Z′ values were calculated between the sample groups corresponding to 0 vs. 1 µM (10−6 M) rosi. Asterisks (*, **, or ***) represent P < 0.05, P < 0.01, or P < 0.001, respectively, vs. the controls (ANOVA followed by Dunnett’s test).