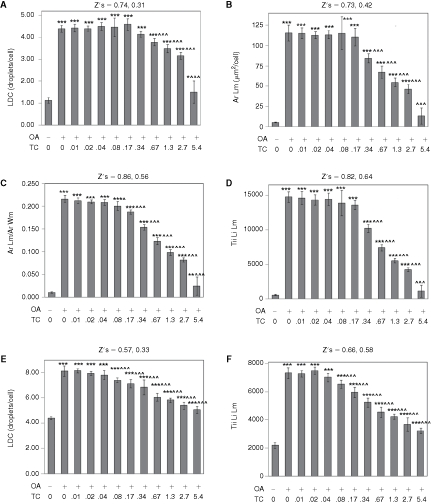
Fig. 7. .

Quantification of oleic acid-induced lipid droplets in AML12 (A–D) and HuH-7 cells (E and F). Cells were treated overnight with 200 µM oleic acid (OA) and triacsin C (TC, µM), as indicated. (A) Lipid droplet count/cell (LDC) for AML12 cells. (B) Average area of the Lipid droplet mask. (C) Average area of the lipid droplet mask normalized to the average area of the whole cell mask. (D) Total integrated intensity of the lipid image over the lipid droplet mask. (E) Lipid droplet count (LDC) for HuH-7 cells. (F) Total integrated intensity of the lipid image over the lipid droplet mask for HuH-7 cells. For A to E, cells were imaged with a 20× objective, and 4 images were analyzed per well (representing 632 to 1,033 cells/well). For F, cells were imaged with a 10× objective, and 8 images were collected and analyzed per well (7,340–9,594 cells per well). For all panels, each bar represents the mean ± SD for n = 8 wells. The first Z′ is for the effect of OA (calculated between first and second columns); the second Z′ is for the effect of 5.4 µM TC in the presence of OA (calculated between the second and final columns). Asterisks (*, **, or ***) represent P < 0.05, P < 0.01, or P < 0.001, respectively, vs. the control wells (first column), ANOVA followed by Newman Keuls post hoc analysis. Carets (^, ^^, or ^^^) represent P < 0.05, P < 0.01, or P < 0.001, respectively, vs. wells treated with OA only (second column).
