
Fig. 8. .
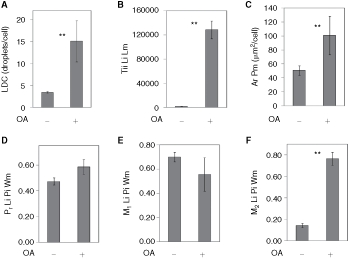
Analysis of lipid droplets and ADFP colocalization in AML12 cells. AML12 cells were cultured in the absence or presence of oleic acid (OA, 200 µM), processed as in Fig. 7, and imaged with a 40× objective. (A) Lipid droplet count (LDC). (B) Total integrated intensity of the lipid image for the lipid mask. (C) Area of the protein mask (ADFP in this experiment). (D) Pearson’s correlation coefficient for the lipid droplet and protein images calculated over the whole cell mask. E and F are the Manders’ M1 and M2 colocalization coefficients, also calculated for the whole cell mask. Each bar represents the mean ± SD for n = 7 or 8 wells, with an average of 413 cells/well. ** P < 0.01 vs. control (ANOVA followed by Dunnett’s test).