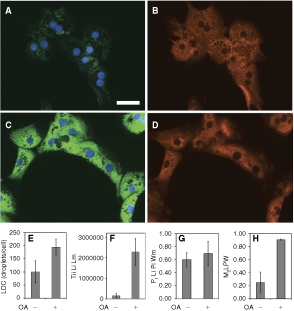
Fig. 9. .

Quantification of lipid droplets and ADFP in primary rat hepatocytes. Hepatocytes, prepared from an adult rat, were cultured for 2 days in DMEM + 10% FBS in a 96-well dish. The cells were exposed to 200 µM oleic acid (OA) overnight, then fixed and labeled for lipid droplets and ADFP. Control cells visualized (40×) for lipid droplets (green) plus nuclei (blue) are shown in A, and the corresponding ADFP (red) image is shown in B. OA-treated cells visualized in the same manner are shown in C and D. The scale bar is 50 µm and applies to A–D. The number of lipid droplet count (LDC) and the total integrated intensity of the lipid image at the lipid mask are shown in E and F, respectively. G and H depict the Pearson’s correlation and the Manders’ M2 coefficients calculated between the lipid droplet and protein images over the whole cell mask, respectively. For E–H, each bar represents the mean ± SD for n = 3 or 2 wells, respectively (5–112 cells/well were analyzed).
