
Figure 2. Characterization of the MHC class I and II presentation of DCs transfected with CIITA DNA.
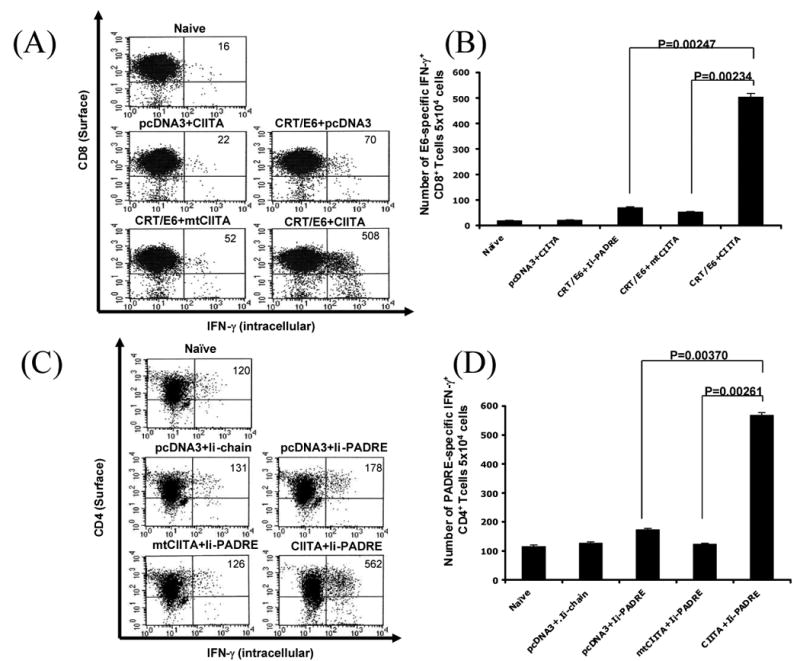
DCs were cotransfected with CIITA DNA and CRT/E6 DNA (A & B) or Ii-PADRE DNA (C & D). The DCs were then incubated with E6-specific CD8+ T cells (A & B) or PADRE-specific CD4+ T cells (C & D) overnight. The activation of antigen-specific T cells was characterized by intracellular cytokine staining followed by flow cytometry analysis using IFN-γ and CD4 or CD8-specific antibodies. A and C. Representative flow cytometry data showing the numbers of activated E6-specific CD8+ T cells (A) and PADRE-specific CD4+ T cells (C) after incubation with the cotransfected DCs. B and D. Bar graphs depicting the numbers of E6-specific CD8+ T cells (B) and PADRE-specific CD4+ T cells (D) (means±s.d.). The data presented in this figure are from one representative experiment of two performed.