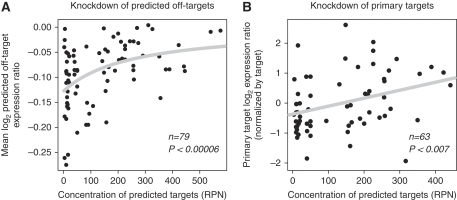
Figure 3.
Target abundance determines siRNA primary target and predicted off-target downregulation. (A) Off-targets for a siRNA experiments show significant correlation. Curve was fit to log(1−a/(x−b)), where a and b were determined by least squares error. (B) The log expression ratio of the primary siRNA target is correlated with predicted off-target concentration. The downregulation for each primary target is normalized such that multiple siRNAs for different targets can be compared.

