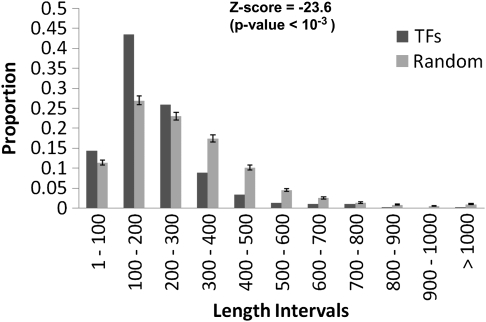
FIG. 3.
Distribution of amino acid sequence lengths for TFs. On x axis, the intervals of protein size are shown and on y axis, the normalized frequency of TFs per interval is shown. Thousand groups of 3,918 protein sequences were randomly retrieved from archaeal genome sequences to compare the length distribution of TFs against other protein-coding genes. In each length internal, bars marked as random represent the proportion of proteins in an interval ± their standard deviations from the average in the random samples.

