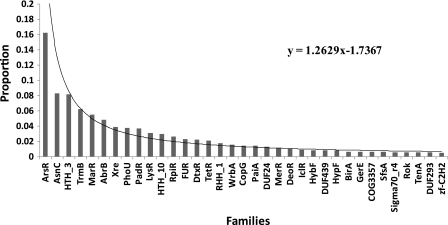
FIG. 4.
Abundance of TF families in archaeal genomes. Proportion of TFs in each family was calculated as the fraction of total TFs identified that belonged to a particular family. The families are displayed from largest to smallest size. Families with less than 20 members were not displayed as they corresponded to less than 6% of the total dataset.

