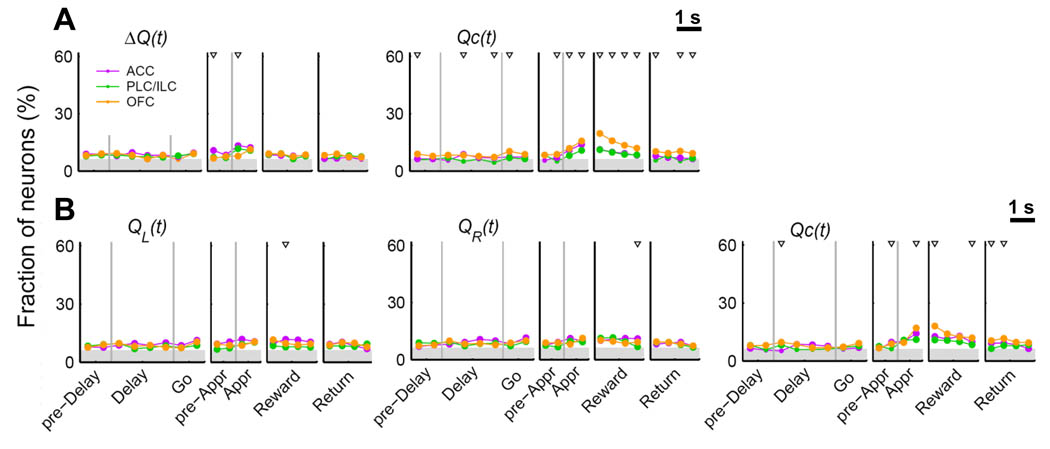
Figure 4.
Neural signals related to different types of value. (A) Fractions of neurons that significantly modulated their activity according to decision value (ΔQ) or chosen value (Qc). (B) The same regression analysis was performed with decision value replaced with left and right action values [QL(t) and QR(t), respectively]. The results for the other variables (eq. 2) were similar to those shown in Figure 3 and are not shown. The analysis time windows and symbols are as in Fig. 2.

