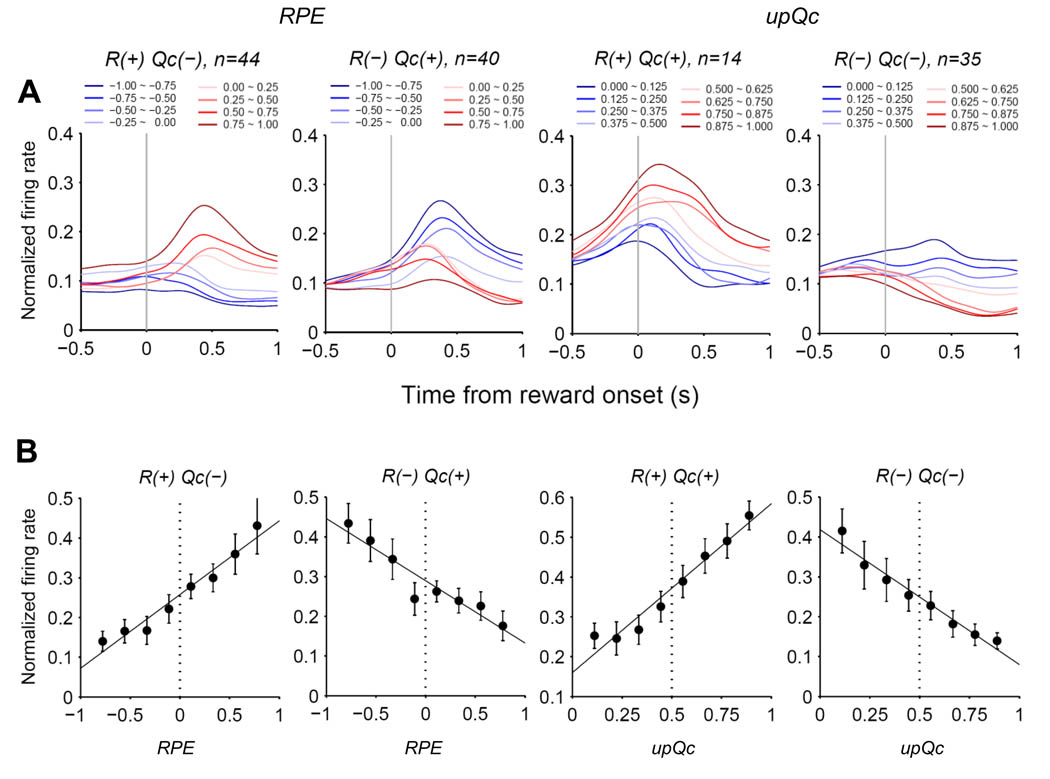
Figure 7.
OFC population activity related to RPE or updated chosen value. Activity of OFC neurons encoding both choice outcome [R(t)] and chosen value [Qc(t)] during the first 1 s of the reward stage were analyzed (n=133). (A) The 133 OFC neurons were divided into 4 groups according to the signs of the regression coefficients for choice outcome and chosen value, and normalized spike density functions (divided by the peak value of each neuron’s spike density function averaged for all trials) were plotted according to 8 equally-divided ranges of RPE or updated chosen value (upQc). The number of neurons in each category is shown above the corresponding plot. (B) Normalized activity averaged across the same groups of neurons during the first 1 s of the reward stage was plotted as a function of RPE or updated chosen value using the set of ranges as in (A). Activity of each neuron was normalized using the mean and SD for all trials. Error bars: SEM.

