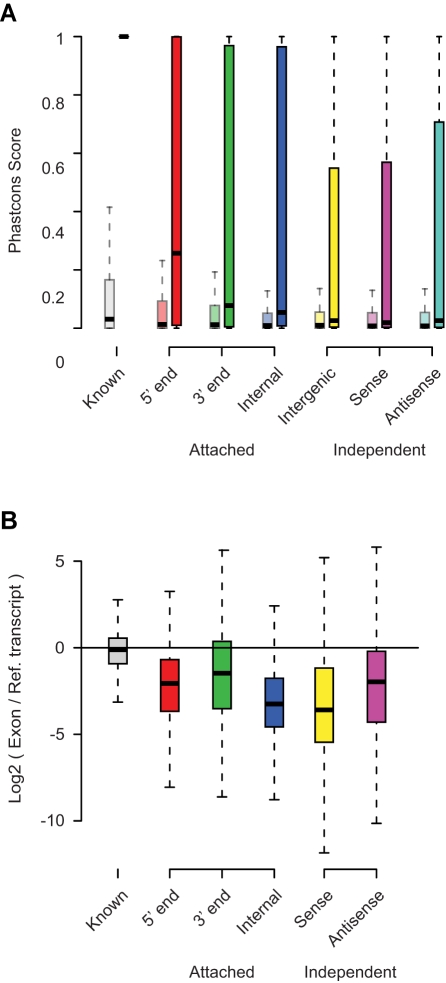
Figure 6. Conservation and usage of human TU exons.
(A) The distribution of PhastCons scores for novel exons in each category as in (A) (darker bars), compared to the distribution of scores from the same set of exons after random reshuffling their positions in the genome (lighter bars). (B) Plot of the ratios between the read coverage of novel exons (calculated in RPB) and the genes they are associated with, either by overlap (sense or antisense) or as additions to known gene structures (5′ end, 3′ end, and internal). The ratios for predicted exons overlapping exons of known gene structures are shown in comparison.

