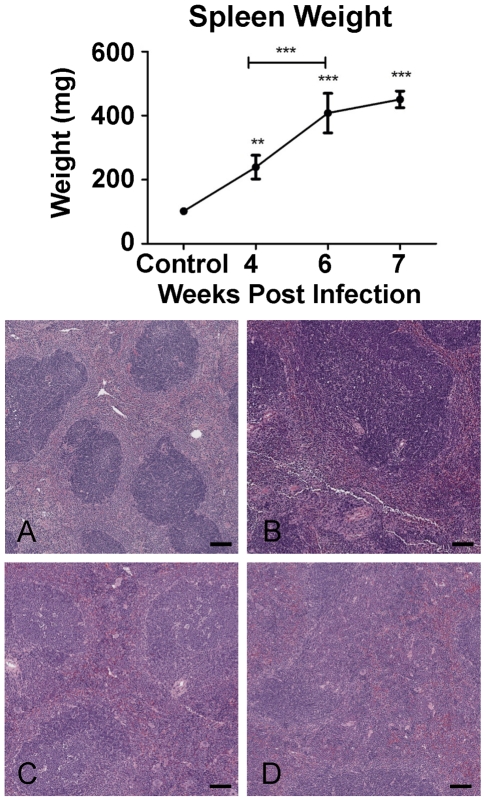
Figure 1. Splenic pathology induced by schistosome infection.
Upper panel: Spleen weight increased over time following S. japonicum infection reaching approximately 4.5 times that of controls at 7 weeks p.i. The graph represents mean spleen weight of mice pooled for microarray analysis ±1SD (n = 4 per group). Lower panel: Schistosome induced splenomegaly was associated with increasing congestion of the red pulp and loss of definition between the red (lighter staining) and white pulp (darker staining) over time A: Control; B: 4 weeks p.i.; C: 6 weeks p.i.; D:7 weeks p.i. (Haematoxylin and eosin ×40; Bar equals 100µm.).

