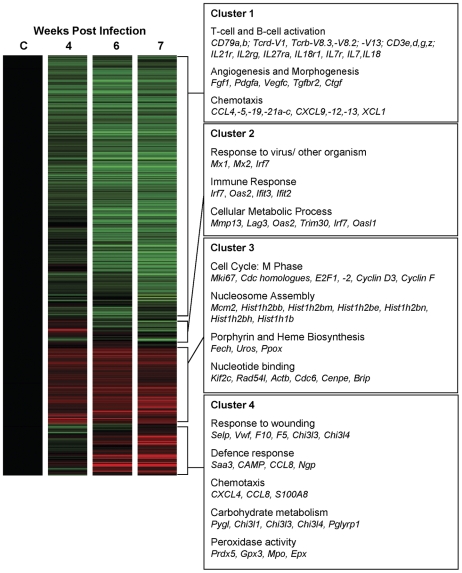
Figure 4. Hierarchical clustering and prominent gene ontologies of genes differentially expressed in the spleen.
Four distinct clusters representing genes that were significantly down-regulated (cluster 1); up-regulated earlier (cluster 2), consistently up-regulated (cluster 3) and up-regulated later (cluster 4) were identified by hierarchical clustering analysis. Prominent biological processes and molecular functions (gene ontologies) associated with genes 2-fold or greater up- or down-regulated in each of these clusters and genes associated with these ontologies are listed in the boxed text. Data are represented in heat map form where green represents down-regulated gene expression, red represents up-regulated expression, with relatively unchanged expression coloured black.

