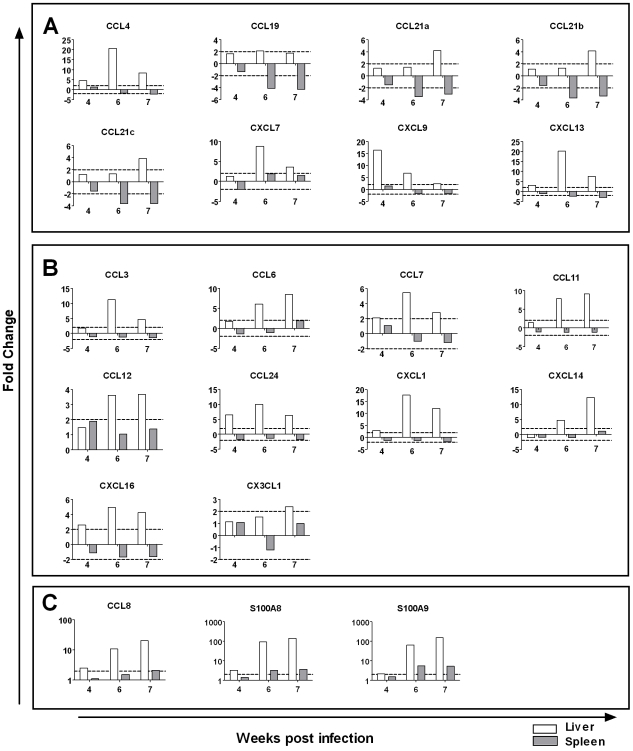
Figure 5. Contrasting expression of chemokines in the liver and spleen by microarray analysis.
Comparison of spleen and liver transcriptional profiles identified a number of chemokines with contrasting expression. A: Chemokines up-regulated in the liver and down-regulated in the spleen during schistosome infection. B: Chemokines up-regulated in the liver and unchanged or below levels of detection in the spleen. C: Chemokines up-regulated in both organs showed greater expression in the liver. Graphs represent average fold change relative to uninfected tissue by microarray analysis. Dotted lines represent a ±2 fold cut-off for biological significance. Expression values for the liver are derived from our previous study of the transcriptional profile of the S. japonicum infected liver [9].

