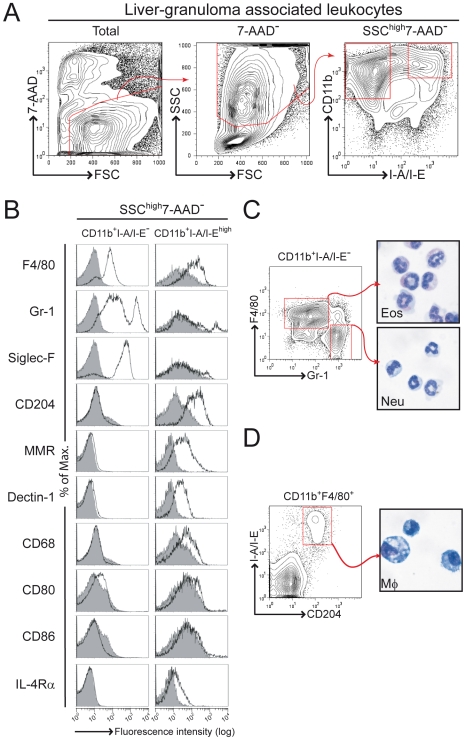
Figure 1. Flow cytometry analysis of liver granuloma during acute schistosomiasis.
BALB/c mice were infected with 100 S. mansoni cercariae, killed 8 weeks later and liver granuloma-associated leukocytes isolated before 4-colour flow cytometry analysis. (A) Gating strategy for analysis of surface expression of CD11b and I-A/I-E on SSChigh and live (7-AAD−) liver granuloma-associated leukocytes. Outlined regions define CD11b+I-A/I-E− and CD11b+I-A/I-Ehigh, respectively. (B) CD11b+I-A/I-E−, and CD11b+I-A/I-Ehigh gated populations in A were analyzed for F4/80, Gr-1, Siglec-F, CD204, MMR, Dectin-1, CD68, CD80, CD86 and IL-4Rα expression, respectively. Greyscale histograms show relevant isotype control. (C) 4-colour flow cytometry analysis of liver granuloma-associated leukocytes gated on CD11b+I-A/I-E− cells as described in A. F4/80 and Gr-1 double staining contour plot is shown. Outlined regions were sorted for cytospin and morphological analysis. (D) 4-colour flow cytometry analysis of liver granuloma-associated leukocytes gated on CD11b+F4/80+ cells as described in A. MHC-II (I-A/I-E) and scavenger receptor-A (CD204) double staining contour plot is shown. Outlined region was sorted for cytospin and morphological analysis. Data are representative of three independent experiments with similar results.

