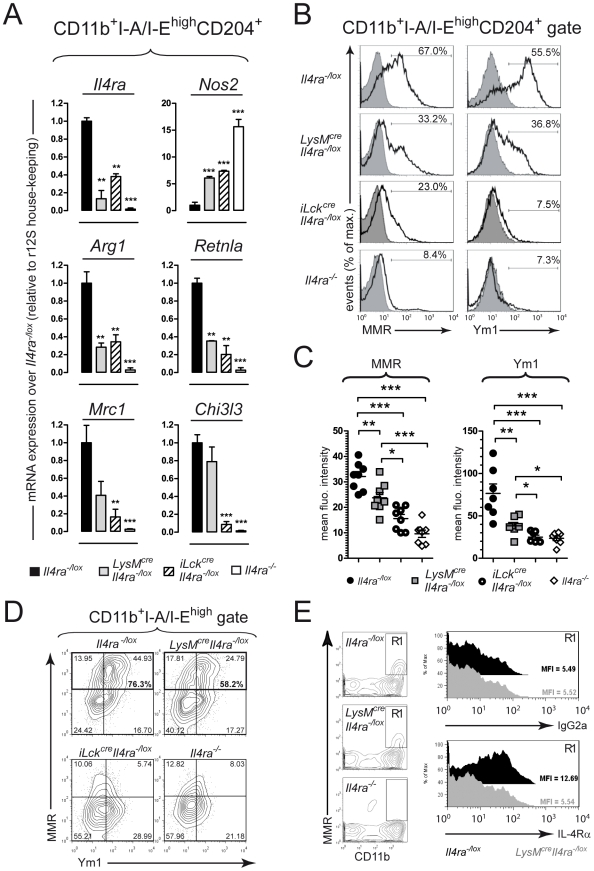
Figure 3. Mannose receptor and Ym1 expression in granuloma macrophages of LysMcreIl4ra−/lox mice.
Il4ra−/lox, LysMcreIl4ra−/lox, iLckcreIl4ra−/lox and Il4ra−/− mice were infected with 100 S. mansoni cercariae, killed 8 weeks later and liver granuloma-associated leukocytes purified. (A) CD11b+I-A/I-EhighCD204+ granuloma macrophages were sorted to high purity (>98%) and RNA extracted before analysis of expression levels of genes associated with macrophage activation by real time RT-PCR: IL-4Rα (Il4ra), nitric oxide synthase (Nos2), arginase 1 (Arg1), FIZZ1 (Retnla), macrophage mannose receptor (Mrc1), and Ym1 (Chi3l3). Relative expression levels normalized to r12S house-keeping gene are shown as fold-change over Il4ra−/lox mice values. Data is representative of two independent experiments with analysis of pooled samples (n = 4). Bars show mean±SD of analyses performed in triplicates. (B) 4-colour flow cytometry analysis of granuloma leukocytes gated on CD11b+I-A/I-EhighCD204+ cells. Representative monoparametric histograms show stainings of surface macrophage mannose receptor (MMR) or intracellular Ym1 expression. Data is representative of four independent experiments of pooled samples (n = 4). Greyscale histograms show relevant isotype control. (C) Mean fluorescent intensities of MMR and Ym1 stainings based on analysis by flow cytometry as presented in B. Data show results of individual mice for 2 independent experiments. (D) 4-colour flow cytometry analysis of granuloma leukocytes gated on CD11b+I-A/I-Ehigh cells. Representative contour plots show MMR/Ym1 double staining and outlined regions show MMR-positive staining. Data is representative of two independent experiments of pooled samples (n = 4). (E) 4-colour flow cytometry analysis of granuloma leukocytes. Analysis gate (R1) was placed on SSChighCD11b+MMR+7-AAD− and histograms show isotype IgG2a (upper panel) and anti-IL-4Rα (lower panel) stainings. Data is representative of two independent experiments of pooled samples (n = 4). Black, Il4ra−/lox; grey, LysMcreIl4ra−/lox. * p<0.05, **p<0.01; ***p<0.001.

