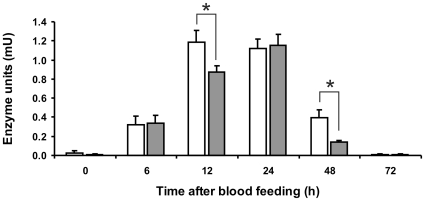
Figure 7. Enzymatic assay performed in solution with trypsin synthetic substrate BAρNA.
Horizontal axis indicates insect midgut samples obtained at different hours ABF. Vertical axis indicate enzyme units detected per midgut. 0: sugar-fed females; 6 to 72: females obtained at 6, 12, 24, 48 and 72 hours ABF. White bars indicate samples obtained from non infected insect midguts. Gray bars indicate samples obtained from infected insect midguts. Samples corresponding to half of one midgut were used in each assay. Statistically significant difference (P<0.05) is marked with an asterisk.

