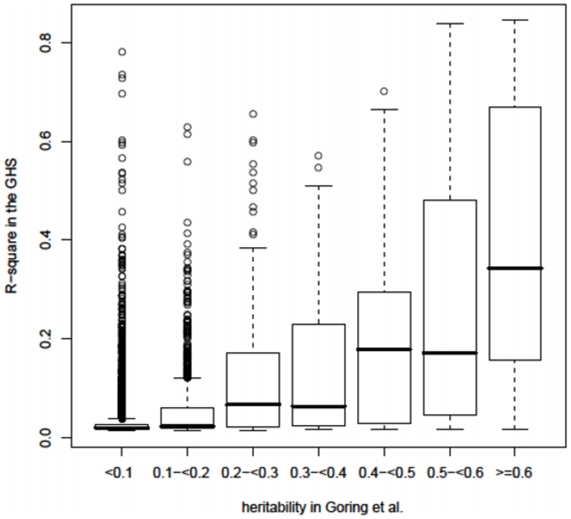
Figure 3. Comparison of the heritability of cis eQTLs estimated in the SAFHS study with the R2 of the corresponding cis eQTLs in GHS.
Data were extracted from Supplementary Table 4 in Göring et al. [4] and comparisons were restricted to genes having a corresponding gene symbol in GHS. Heritability in the SAFHS was estimated by linkage analysis and accounts for the whole variability at a locus while R2 refers to a single eSNP (the best eSNP) and therefore underestimates the global variability affecting gene expression at a locus. The data used to generate this figure are provided in File S5. The median R2 was globally lower than the heritability, consistent with the fact that the R2 is referring to a single SNP whereas heritability reflects the whole genetic variation at a locus.

