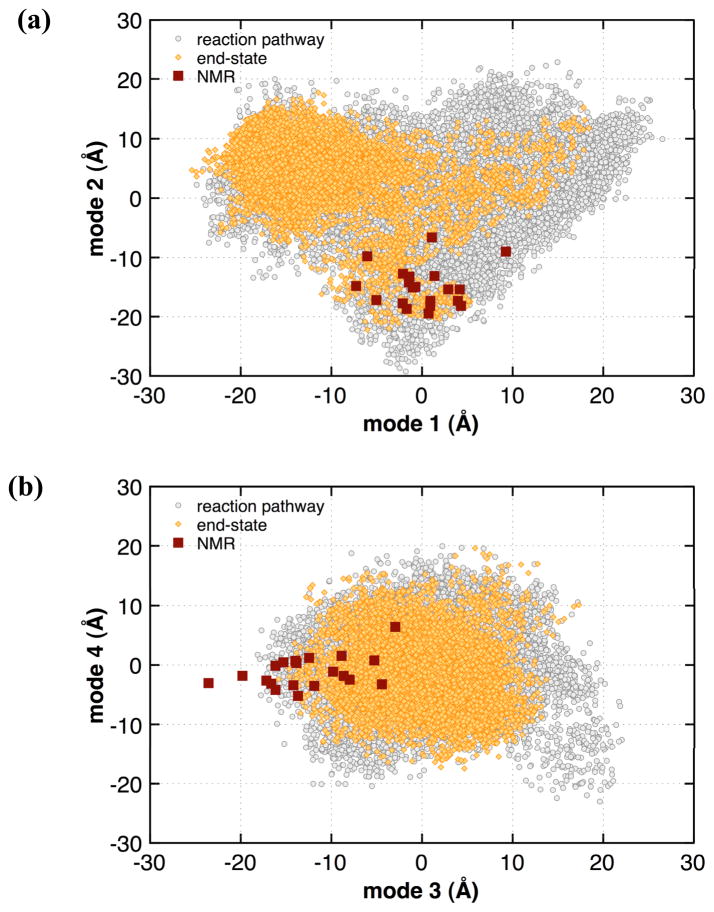
Figure 11. Projection of MD and NMR structures on the modes coupled to the reaction catalyzed by CypA.
(a) mode 1 vs mode 2 (b) mode 3 vs mode 4. The grey open circles correspond to the projections from the set of 18,500 conformations sampled along the reaction pathway; red squares correspond to the NMR structures. The yellow filled circles correspond to the end-states MD only. Note the computed projections represent summation over all atoms in the protein.

