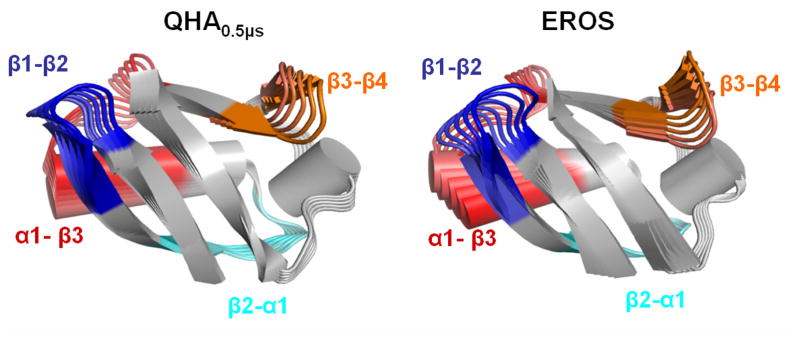
Figure 5. Comparison of the slowest mode of ubiquitin at microsecond time-scale based on QHA0.5μs (computational) and EROS ensemble (experimental).
The modes are depicted in a movie like fashion, with subsequent conformations shown in lighter colors. Four regions of the protein are highlighted with different colors and labeled; these regions indicate large displacements. These motions involve a pincer-like motion involving β1-β2, C-terminal part of α1 helix and α1-β3 loops. The amplitudes of the motions are arbitrarily scaled for visualization, however, see text for comparison of the coverage of conformational landscape.

