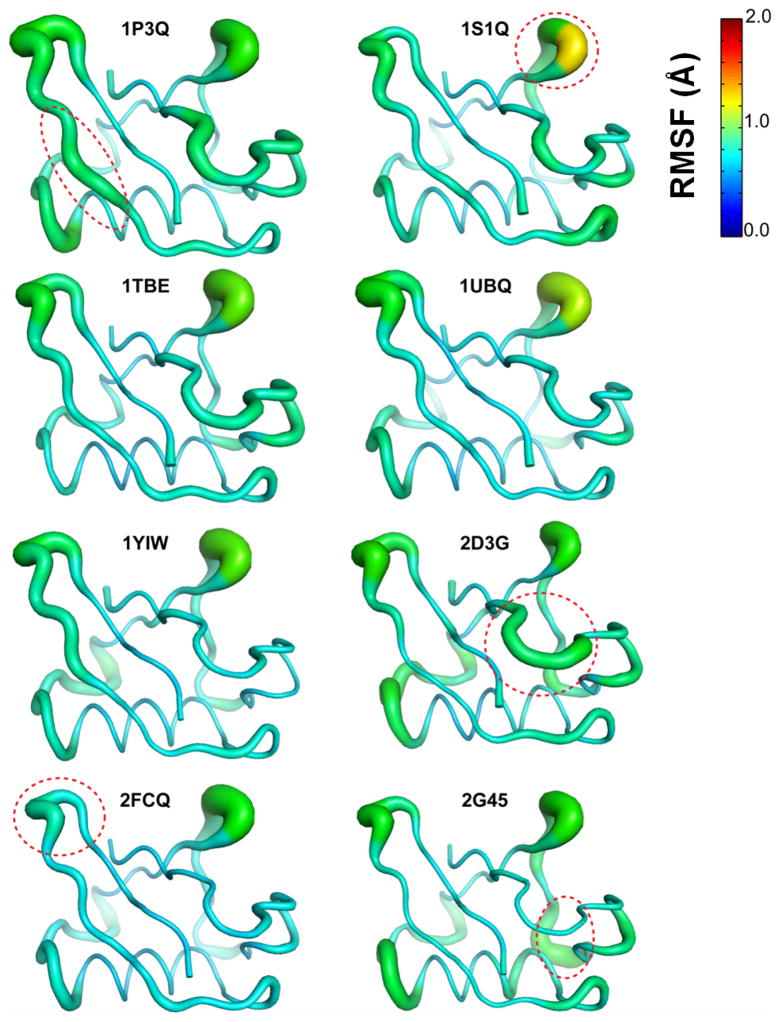
Figure 7. Average RMS fluctuations determined based on NMA of ubiquitin, based on 8 structures used in this study.
The displacement vectors for the slowest 10 modes were aggregated (by summing all atomic displacements in the modes) and averaged for 12 conformations. Note, that the fluctuations are colored on the same scale as results of QHA analysis (Figure 4). The circled areas indicate regions with flexibility which is not reproduced in other structures. These results show lower amplitudes and less reliable modes than QHA.

