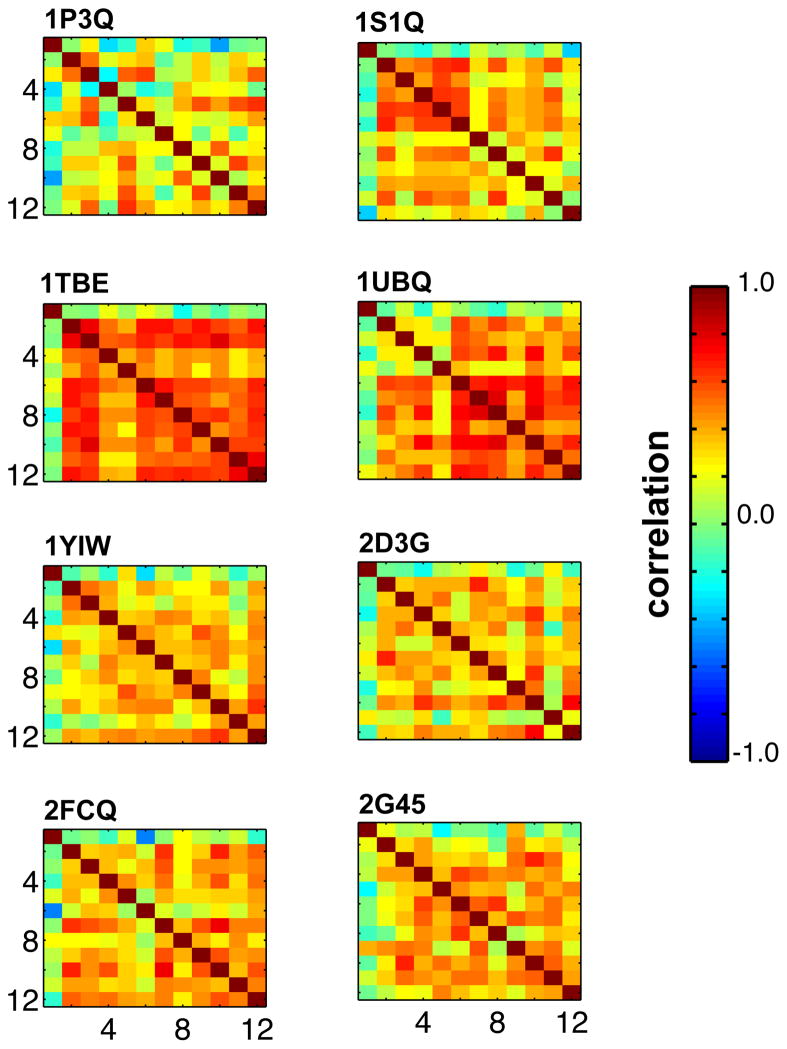
Figure 8. Correlation of positional fluctuations as computed by NMA for structures along the 8 MD trajectories.
The 8 plots indicate the 8 MD systems used in this study. NMA was performed on 12 structures in each trajectory separated by 5ns (5ns, 10ns, …, 60ns) and the degree of correlations of normal modes between the 12 structures are shown as a matrix. The degree of correlation was obtained as taking a dot product of all eigenmodes following by normalization. These results indicate change in NMA modes over the course of the MD trajectory, except for 1TBE and 1UBQ that seem to be sampling in the nearby areas.

