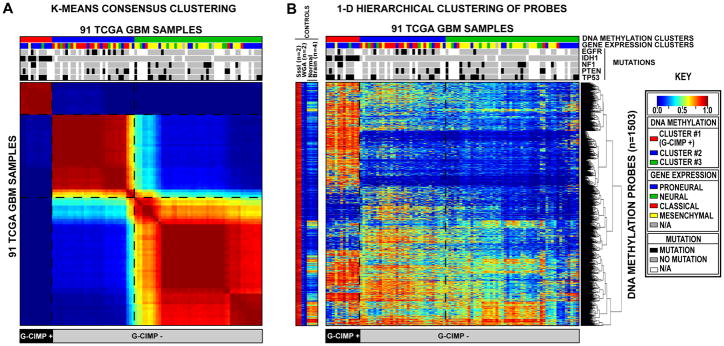
Figure 1. Clustering of TCGA GBM tumors and control samples identifies a CpG Island Methylator Phenotype (G-CIMP).
Unsupervised consensus clustering was performed using the 1,503 Infnium DNA methylation probes whose DNA methylation beta values varied the most across the 91 TCGA GBM samples. DNA Methylation clusters are distinguished with a color code at the top of the panel: red, consensus cluster 1 (n=12 tumors); blue, consensus cluster 2 (n=31 tumors); green, consensus cluster 3 (n=48 samples). Each sample within each DNA Methylation cluster are colored labeled as described in the key for its gene expression cluster membership (Proneural, Neural, Classical and Mesenchymal). The somatic mutation status of five genes (EGFR, IDH1, NF1, PTEN, and TP53) are indicated by the black squares, the gray squares indicate the absence of mutations in the sample and the white squares indicate that the gene was not screened in the specific sample. G-CIMP-positive samples are labeled at the bottom of the matrix. A) Consensus matrix produced by k-means clustering (K = 3). The samples are listed in the same order on the x and y axes. Consensus index values range from 0 to 1, 0 being highly dissimilar and 1 being highly similar. B) One-dimensional hierarchical clustering of the same 1,503 most variant probes, with retention of the same sample order as in Figure 1A. Each row represents a probe; each column represents a sample. The level of DNA methylation (beta value) for each probe, in each sample, is represented by using a color scale as shown in the legend; white indicates missing data. M.SssI-treated DNA (n=2), WGA-DNA (n=2) and normal brain (n=4) samples are included in the heatmap but did not contribute to the unsupervised clustering. The probes in the eight control samples are listed in the same order as the y axis of the GBM sample heatmap. See also Figure S1 and Table S1.

