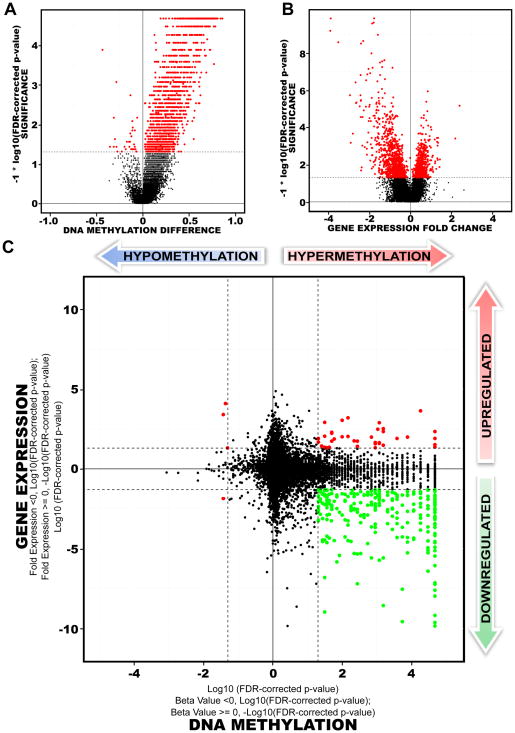
Figure 4. Comparison of transcriptome versus epigenetic differences between proneural G-CIMP-positive and G-CIMP-negative tumors.
A) Volcano Plots of all CpG loci analyzed for G-CIMP association. The beta value difference in DNA Methylation between the proneural G-CIMP-positive and proneural G-CIMP-negative tumors is plotted on the x-axis, and the p-value for a FDR-corrected Wilcoxon signed-rank test of differences between the proneural G-CIMP-positive and proneural G-CIMP-negative tumors (−1* log10 scale) is plotted on the y-axis. Probes that are significantly different between the two subtypes are colored in red. B) Volcano plot for all genes analyzed on the Agilent gene expression platform. C) Starburst plot for comparison of TCGA Infinium DNA methylation and Agilent gene expression data normalized by copy number information for 11,984 unique genes. Log10(FDR-adjusted P value) is plotted for DNA methylation (x-axis) and gene expression (y-axis) for each gene. If a mean DNA methylation β-value or mean gene expression value is higher (greater than zero) in G-CIMP-positive tumors, −1 is multiplied to log10(FDR-adjusted P value), providing positive values. The dashed black lines indicates FDR-adjusted P value at 0.05. Data points in red indicate those that are significantly up- and down-regulated in their gene expression levels and significantly hypo- or hypermethylated in proneural G-CIMP-positive tumors. Data points in green indicate genes that are significantly down-regulated in their gene expression levels and hypermethylated in proneural G-CIMP-positive tumors compared to proneural G-CIMP-negative tumors. See also Figure S5 and Table S3.

