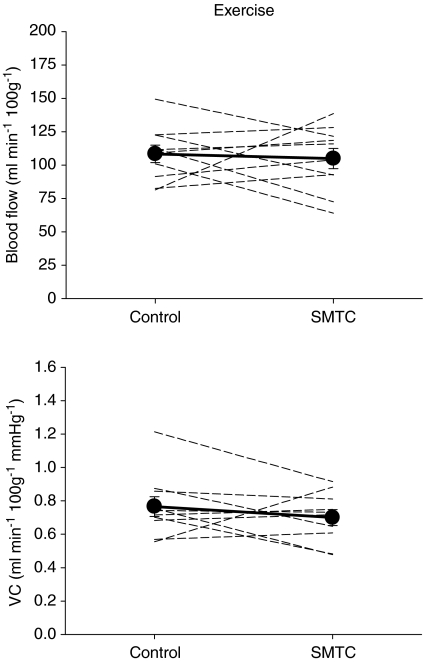
Figure 5. Effects of SMTC (2.1 ± 0.1 μmol kg−1) on exercising total hindlimb blood flow (top panel) and vascular conductance (VC, bottom panel).
Individual animals (dashed lines, n= 10) and mean values (filled symbols) are plotted. There were no differences (P > 0.05) between control and SMTC for either measurement.

