
Figure 6.
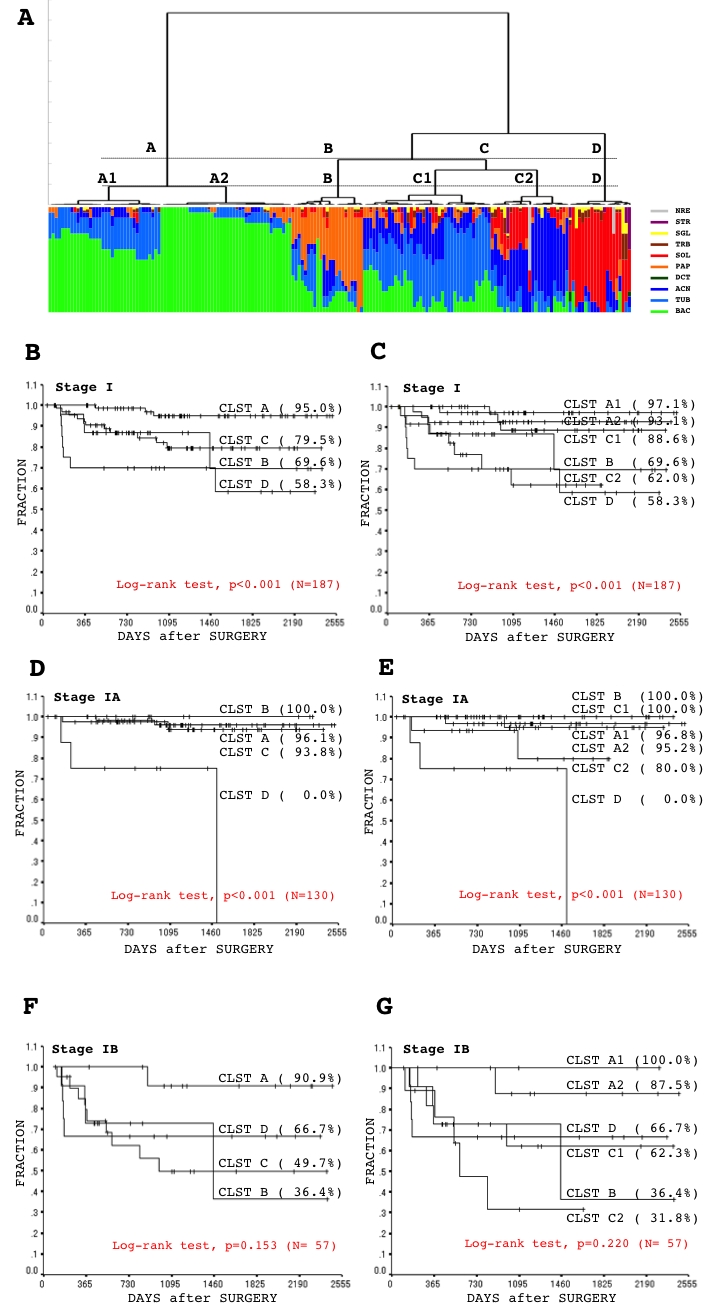
(see A-D in previous page) (A) Results of hierarchical clustering based on an element of histological architecture in the form of a dendrogram (upper panel). A threshold (upper panel, dashed lines) was set to divide lung tumors into four clusters (A to D) and six sub-clusters (A1, A2, B, C1, C2, and D). Proportions of different architectural elements among individual tumors are plotted below the dendrogram (lower panel: BAC, bronchioloalveolar; TUB, tubular; ACN, acinar; DCT, ductular; TRB, trabecular; PAP, papillary; SOL, solid; SGR, single; SRT, striated; NER, neuroendocrinal). (B to G) Five-year disease-free survival curves evaluated from a Kaplan-Meier analysis among the architectural clusters (stage I whole (B), stage IA (D), stage IB (F)) and sub-clusters (stage I whole (C), stage IA (E), stage IB (G)). CLST means cluster. Values in parentheses are estimated five-year disease-free survival rates.