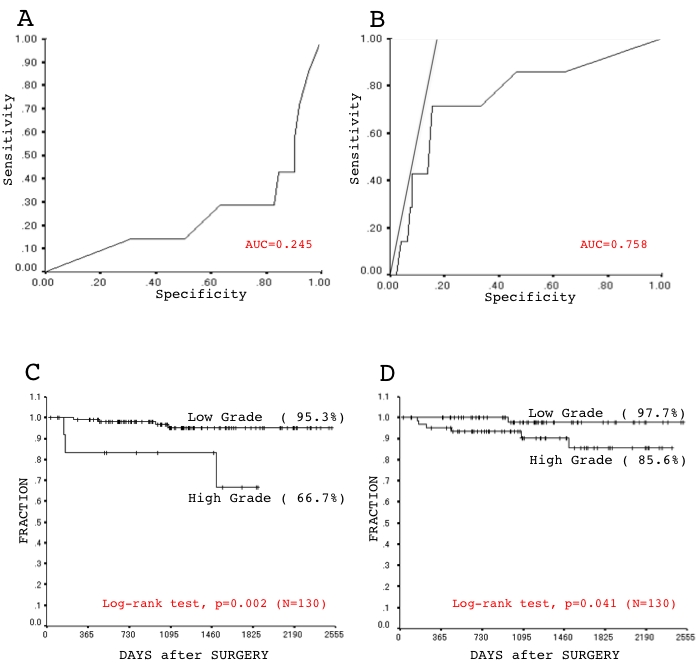
Figure 8.

The relative operating characteristic (ROC) curve was described based on the proportion of either low-grade (A) or high-grade (B) components among tumors of stage IA ADC. AUC is the area under the curve (AUC). Five-year disease-free survival curves was evaluated based on a Kaplan-Meier analysis of the sub-groups according to a cut-off value of 72.0% (C) and of 9.0% (D) in a proportion of the high-grade component among stage IA disease. Values in parentheses are estimated five-year disease-free survival rates.
