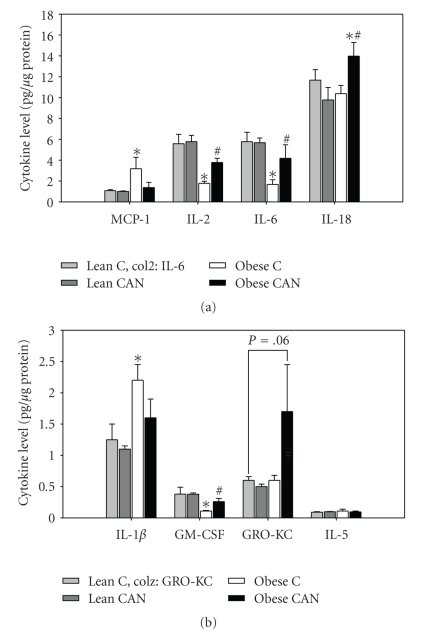
Figure 4.
Mean kidney cytokine levels (all rats detectable) (a) higher level cytokines including: monocyte chemotactic protein-1 (MCP1), interleukin-2 (IL-2), interleukin-6 (IL-6), and interleukin-18 (IL-18); (b) lower level cytokines including: interleukin 1β(IL-1β),granulocyte macrophage colony-stimulating-factor (GM-CSF), growth regulated oncogene (GRO-KC), and interleukin-5 (IL-5) in whole kidney tissue homogenate from candesartan treated (CAN) or untreated (C) lean and obese rats at the end of 14 weeks of treatment (n = 8 per body type/treatment). ∗ indicates a significant difference (P < .05) from lean control mean and # from obese control mean, by unpaired t-test.

