Fig. 10.
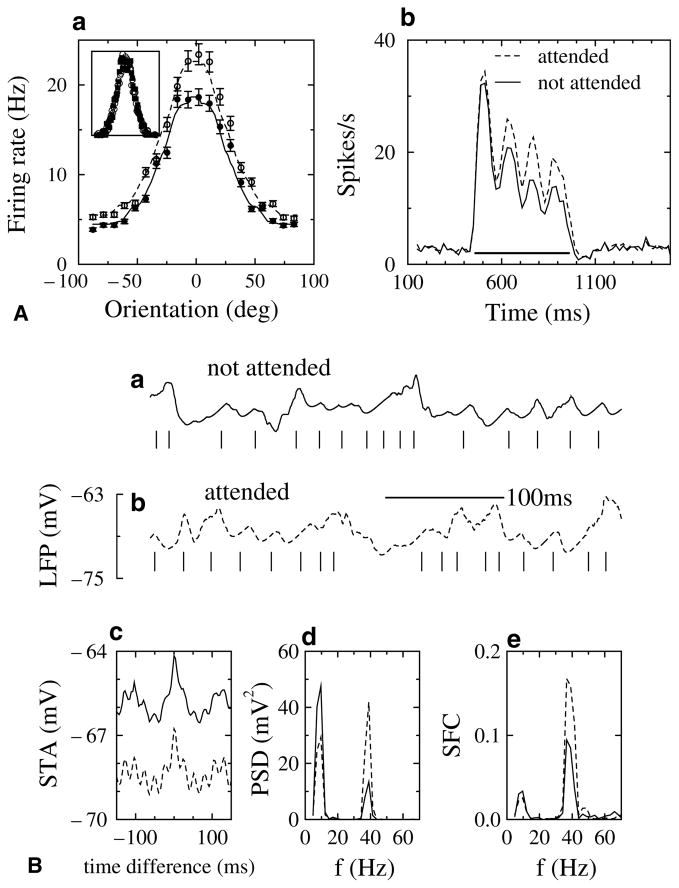
Modulation of inhibitory synchrony in model simulations reproduced attentional modulation of V4 neurons observed in experiment. (A) Model of attentional modulation in McAdams and Maunsell [49]. The neuron received synchronous inhibitory input. (a) Firing rate as a function of stimulus orientation for two conditions: (solid lines, filled symbols) attention was directed away from the receptive field, σIV = 8 ms and (dashed lines, open symbols) attention was directed into the receptive field, σIV = 7 ms. Inset: The two curves coalesced when the asymptotic firing rate was subtracted and the residual of the solid line was rescaled by a factor 1.2 along the y-axis. (b) Temporal dynamics of attentional modulation of the firing rate. The bar indicates the presence of a driving current representing the presence of a stimulus in the receptive field. (Solid line) Attention directed away from receptive field, σIV = 3 ms and (dashed line) into the receptive field, σIV = 2 ms. (B) Model of attentional modulation reported in Fries et al. [29]. A neuron received synchronous inhibitory input in the gamma-frequency range, and excitatory input in the theta-frequency range. For the solid lines attention was directed away from the receptive field, σIV = 5 ms, and for the dashed lines attention was directed into the receptive field, σIV = 4 ms. (a–b, top) The local field potential (LFP) and (bottom) a spike train from one neuron. (c) The spike-triggered average (STA) of the LFP, the solid line was shifted by +2 mV for clarity. (d) Power spectrum density (PSD) of the STA. (e) The spike field coherence (SFC). The full set of parameter values is given in Appendix A.

