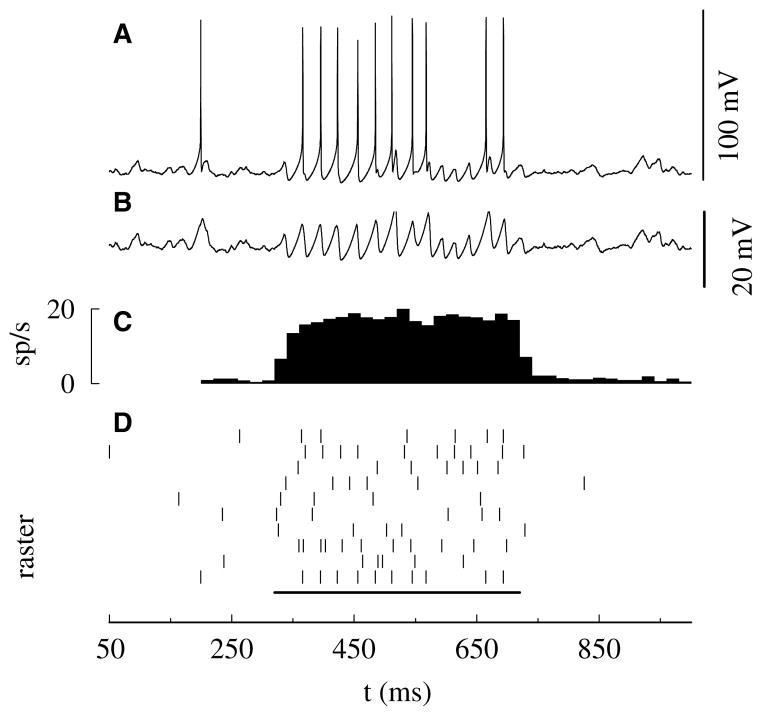
Fig. 2.
Inhibitory input synchrony gated neural activity. (A) The membrane potential, (B) the local field potential (LFP), and (C) the firing rate as a function of time. (D) Rastergram of the first ten trials. During the time interval between t = 300 and 700 ms (indicated by the bar in (D)), σIV was reduced to 2 ms from 8 ms. The full parameter set is given in Appendix A.

