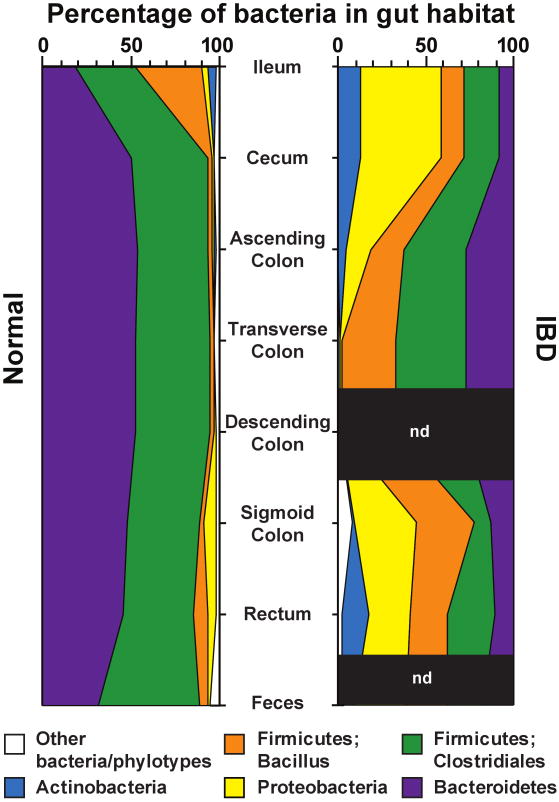
Figure 2. Bacterial phyla identified in the human gut microbiota.
Distribution of predominant bacterial phylotypes in the human intestinal tract. The graphs depict relative abundance as a function of location along the cephalocaudal axis of the distal gut. DNA sequences were compiled from the studies of Eckburg et al. (2005) and Frank et al. (2007). Phylogenetic classifications were made by parsimony insertion of aligned sequences into an 16S rRNA tree provided by the Greengenes database (DeSantis et al., 2006), using ARB (Ludwig et al, 2004). Abbreviations: IBD, samples from patients with either Crohn's disease or ulcerative colitis (Frank et al., 2007); Normal, data from healthy young adults from Eckburg et al (2005) plus the non-IBD controls reported in Frank et al. (2007); n.d., not done. A total of 18,405 16S rRNA sequences were analyzed (5,405 IBD, 13,000 normal).

