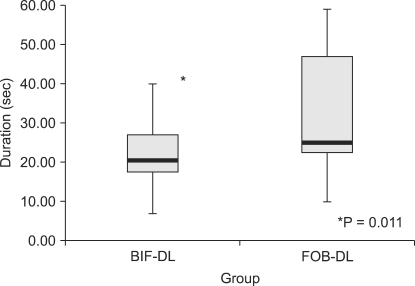
Fig. 3.
Comparison of the time required to visualize the vocal cords during the last successful attempt (T1) between the two groups. T1 was significantly shorter in the Bonfils intubation fiberscope (BIF) group. Box plot shows the median (thick line in the box), interquartile range (box), and range (whiskers).

