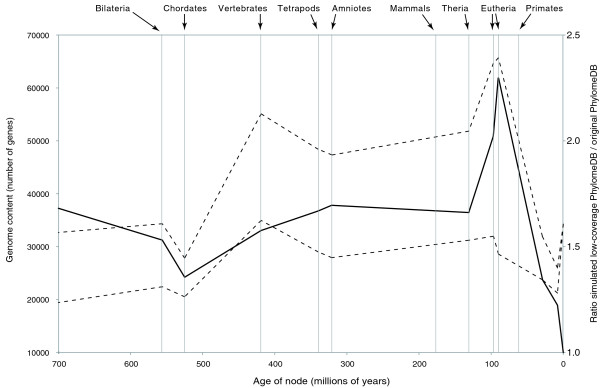
Figure 8.
Simulations of low-coverage genomes and their impact on gene content inference through evolutionary time. The analysis is performed with the original human phylome (PhylomeDB, lower dashed line) and a simulated low-coverage PhylomeDB (upper dashed line) in which stretches of ambiguous sequences have been introduced in the protein sequences of three of the seven eutherian species. The transformation of these high-coverage genomes into simulated low-coverage genomes generates artifactual gains all across the species tree, but more acutely so at the basal eutherian nodes (the plain line, and secondary axis, indicates the ratio of genome content between the simulated low-coverage PhylomeDB and the original PhylomeDB).

