Figure 7.
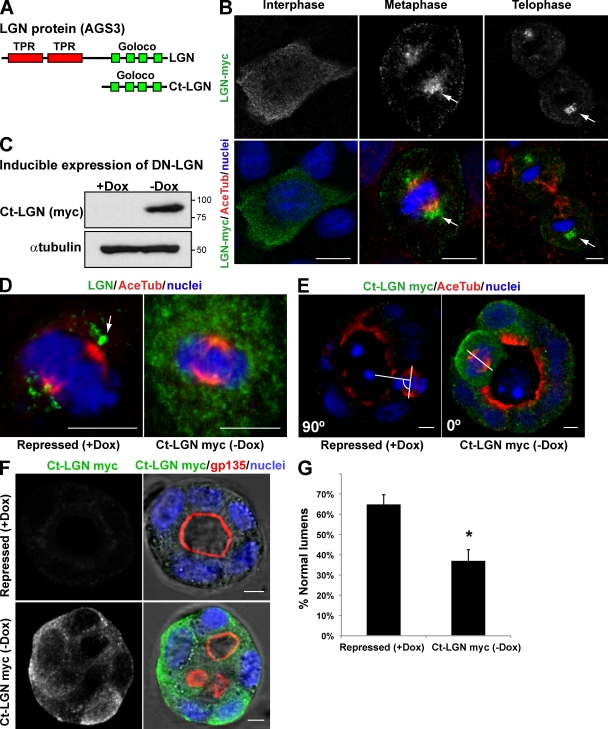
Expression of a dominant-negative form of LGN in MDCK cells disrupts mitotic spindle organization in cysts and interferes with normal lumen formation. (A) Schematic diagram of LGN protein domains and the C-terminal region (Ct-LGN) containing the four GoLoco domains that were used as the dominant-negative form of LGN. (B) Confocal images of LGN-myc localization in MDCK cells in different phases of the cell cycle. MDCK cells expressing LGN-myc (top) were plated in a monolayer and stained for acetylated tubulin (Ace Tub) and chromatin (blue; merge images in bottom panels). In cells in interphase (left), LGN localized to the cytoplasm. In cells in metaphase (middle) and telophase (right), LGN localized to the spindle poles. Arrows indicate the localization of LGN-myc. (C) Inducible expression of the dominant-negative (DN) form of LGN (Ct-LGN–myc). MDCK cells expressing Ct-LGN–myc under the control of the tet-off repressor were plated to form cysts for 72 h in the presence of Dox (Ct-LGN–myc expression repressed) or not (induced). Total lysates were Western blotted for myc (top) or α-tubulin (bottom). Molecular mass is indicated in kilodaltons. (D) Confocal microscopy images of the effect of Ct-LGN on endogenous LGN localization. Cells expressing Ct-LGN–myc were plated to form monolayers for 72 h in the presence (Ct-LGN–myc repressed) or the absence (Ct-LGN–myc induced) of 20 µmol Dox. Cells were stained to detect acetylated tubulin, LGN, and chromatin (blue). The arrow indicates the localization of LGN. (E) Confocal microscopy images of the effect of Ct-LGN on mitotic spindle orientation in cysts. Cells expressing Ct-LGN–myc were plated to form cysts for 72 h in the presence (Ct-LGN–myc repressed) or the absence (Ct-LGN–myc induced) of 20 µmol Dox. Cells were stained to detect acetylated tubulin, myc (green), and chromatin (blue). The angles between the apicobasal axis and the spindle axis (white lines) are indicated in the lower left corners. (F) Confocal microscopy images of the effect of Ct-LGN in MDCK cysts on lumen formation. Cells expressing Ct-LGN–myc were plated to form cysts for 72 h in the presence (Ct-LGN–myc repressed) or the absence (Ct-LGN–myc induced) of 20 µmol Dox. Cells were stained to detect gp135, myc (green), and nuclei. (G) Quantification of cysts with normal lumens in cells expressing or not Ct-LGN–myc. Values are mean ± SD from three different experiments (n = 100 cysts/experiment; *, P < 0.001). Bars, 5 µm.

